Overview
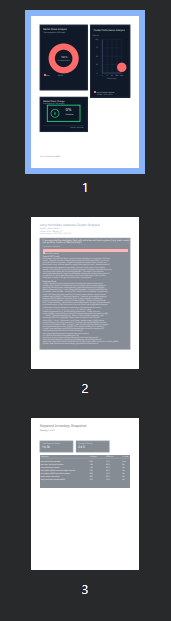
The Dashboard is where you can track how your brand is performing in AI responses. Different charts display different types of information.
Market Share Analysis:
The Market Share Analysis chart shows how often your brand is cited and how it performs in AI responses compared to your competitors.
If a competitor appears in more AI answers than your brand, it will have a higher percentage share.
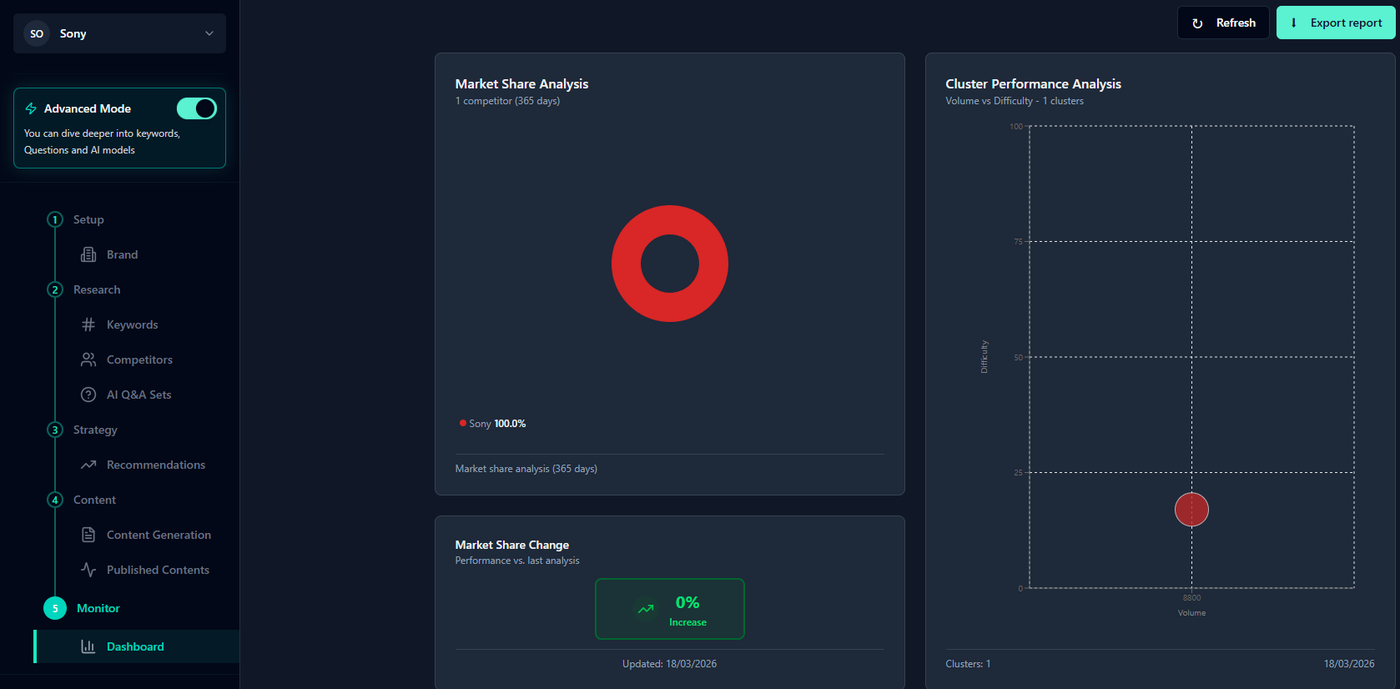
Cluster Performance Analysis:
This chart shows the volume and difficulty of your AI Q&A Sets.
Each circle represents an AI Q&A Set. When you hover over a circle, you can see your brand’s market share within that set.
If no competitors are cited and only your brand appears, it will have a 100% market share.
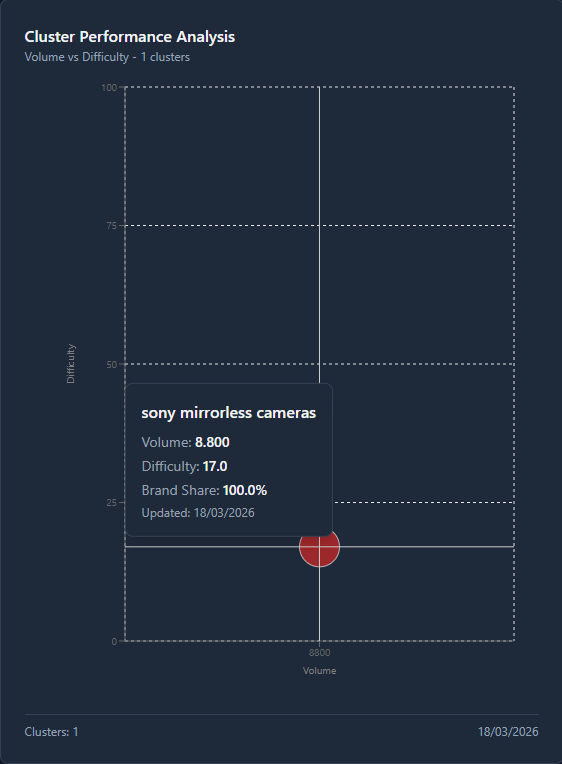
Market Share Change:
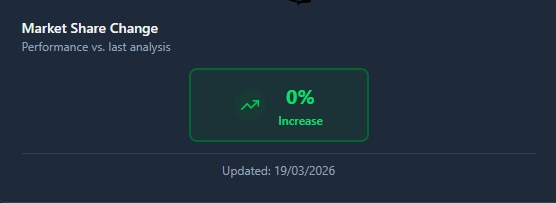
This section shows whether your brand mentions are increasing or decreasing over time.
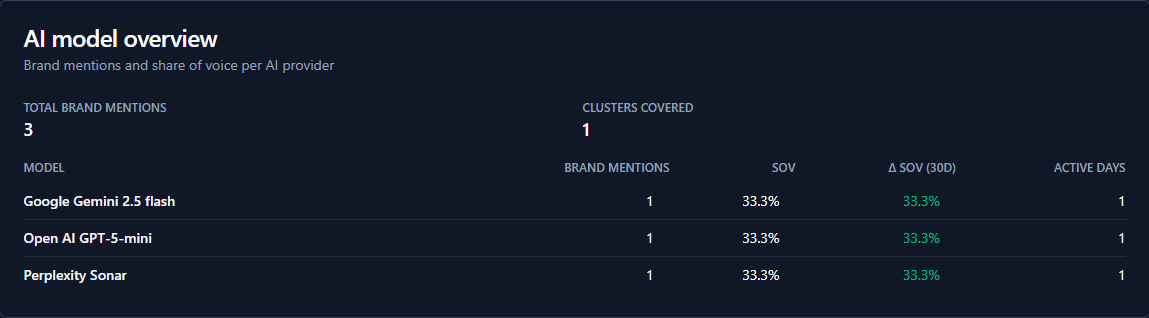
AI Model Overview:
This chart shows:
Which AI models cite your brand the most
Your share of voice across different AI models
Export Relatory
You can export a report of your brand as a PDF file. This report provides a summary of your brand’s performance, including charts, AI Q&A Sets, and keywords.